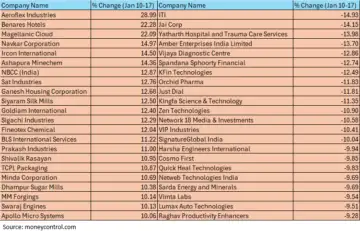
Broader indices fall continue but these 22 smallcaps give double digit return – Read
The broader indices performed inline with main indices and continued the losing streak in the second straight week, declining between 0.5-1 percent.
This week, BSE Sensex declined 759.58 points or 0.98 percent to finish at 76,619.33, while the Nifty50 index shed 228.3 points or 0.97 percent to end at 23,203.20.
However, among broader indices BSE Mid-cap and BSE Small-cap indices shed 1 percent each, while BSE Large-cap index was down 0.5 percent.
Among sectors, Nifty Information Technology index shed nearly 6 percent, Nifty Realty down 2.5 percent, Nifty Healthcare, Media, FMCG indices fell more than 2 percent each, while Nifty PSU Bank, Metal indices rose 3 percent each.
Foreign Institutional Investors (FIIs) sold equities worth Rs 25,218.60 crore during the week, while Domestic Institutional Investors (DII) bought equities worth Rs 25,151.27 crore.
However, in this month till now, FIIs offloaded equities worth Rs 46,576.06 crore and DIIs purchased equities worth Rs 49,367.14 crore.
“The Nifty-50 Index and Sensex each lost 1% in the past week. Even the mid-cap index and small-cap index lost around 1% in the past week. Decent 3QFY25 earnings of large cap stocks were unable to improve the market sentiment amid rising crude oil prices (+5%) and continued depreciation of INR (-0.6%) in the past week,” said Shrikant Chouhan, Head Equity Research, Kotak Securities.
“The BSE Small-cap index tumbled 6 percent with Jai Corp, KEC International, Inox Wind, Skipper, Oriental Rail Infrastructure, Garware Hi-Tech Films, Blue Star, PCBL falling between 15-23 percent.
However, Spandana Sphoorty Financial, PTC Industries, Coffee Day Enterprises, Vijaya Diagnostic Centre, Pokarna added between 10-19 percent.
Where is Nifty50 headed?
Amol Athawale, VP-Technical Research, Kotak Securities:
Technically, on the daily and intraday charts, it is still holding a lower top formation, which suggests further weakness from the current levels. We believe that the current market texture is weak but oversold; hence, level-based trading would be the ideal strategy for short-term traders.
For bulls, 23300/76900 would act as a key resistance level. Above this level, we could see an extension of the pullback rally up to 23500/77500 and 23590/77800, or the 20-day Simple Moving Average (SMA). On the other hand, 23100/76300 will serve as a key support zone. Below this level, the market could slip to 23000/76000, with further weakness potentially dragging the index down to 22850/75700.
For Bank Nifty, as long as it is trading below 49200, weak sentiment is likely to continue. On the downside, it could touch levels of 48000-47600. However, if it breaks above 49200, the chances of hitting 49800-50000 would increase significantly.
Nagaraj Shetti, Senior Technical Research Analyst at HDFC Securities
Nifty on the weekly chart formed a small bullish candle with minor upper and lower shadow. Technically, this weekly market action signals formation of doji type candle pattern. Normally a doji pattern after a reasonable weakness could be an impending reversal signal post confirmation.
The short-term trend of Nifty remains weak amidst range movement. A decisive upside above 23400 could only open renewed buying enthusiasm in the market. Immediate support is placed at 23100.
Jatin Gedia – Technical Research Analyst at Mirae Asset Sharekhan
On the downside we expect the Nifty to slip towards the psychological level of 23000 and below that it can potentially slip towards 22670. Failure of follow through selling pressure on the downside can lead to a consolidation within 23100 – 23300.


Comments are closed.