
The most expensive way to discover a performance problem is to have a user report it. By that point, the slow query has already executed millions of times, the cache miss rate has already been elevated for days, and the thread pool that started queuing requests three hours ago has been the bottleneck that nobody noticed because the monitoring dashboard looked at CPU.
Server-side performance tuning exists to find these problems earlier (during development, during load testing, or during a structured review) before they become the production incident that prompts the after-the-fact investigation.
A slow query will kill performance faster than a failing pod. The database is often the silent killer; if you are seeing latency spikes, check for missing indexes, expensive joins, and poorly cached queries. But the principle that precedes all specific fixes is the same: don’t guess, measure. Performance intuition is consistently wrong about which function, which query, or which component is the actual bottleneck. Profiling is the measurement discipline that makes every other performance investment.
Profiling: Replacing Guesses With Measurements
The first step of performance optimisation is always profiling, identifying the slowest lines of code before changing anything. Profiling converts a search problem into a measurement problem, and measurement is faster than guessing.
Application-level profiling captures where CPU time is spent during request processing. Language-native profilers (dotnet-trace for .NET applications, py-spy for Python, async-profiler for JVM applications, pprof for Go) produce flame graphs that visualize the call stack during execution, immediately revealing which functions consume the most time. A flame graph that shows 70% of request time spent in a single serialization step, or in a function that performs a database lookup inside a loop, identifies the bottleneck more precisely than any hypothesis.
The distinction between CPU profiling and wall-clock profiling is significant for server-side applications. CPU profiling captures computation time, the time the process spent executing instructions. Wall-clock profiling captures elapsed time, the time a function took from entry to exit, including any time spent waiting for I/O, locks, or network responses. A server-side function that takes 2ms of CPU time but 200ms of wall-clock time is waiting for 198ms: waiting for a database response, waiting for a cache, waiting for a lock. CPU profiling misses this entirely; wall-clock profiling reveals it immediately.
The profiling cadence that most high-performance teams converge on treats profiling as a continuous practice. Profiling runs in production using sampling-based profilers (which add negligible overhead by capturing a statistical sample of call stacks), and the results are reviewed after each release to confirm that the changes in that release did not introduce new hot paths.
Slow Query Analysis: Finding the Database Bottleneck
The practical starting point for any database performance investigation is always the slow query log. Enable MySQL slow query log, PostgreSQL pg_stat_statements, or MSSQL Query Store and identify the top 20 slowest queries by total execution time before changing anything; this is the discipline that prevents hours spent tuning queries that are fast but frequent, when the actual bottleneck is a rare query that takes thirty seconds when it runs.
The slow query log surfaces queries sorted by total execution time, which is the correct sort order for optimization priority. A query that executes in 10ms but runs 100,000 times per day contributes 1,000 seconds of total execution time; a query that executes in 5 seconds but runs once per hour contributes 5 seconds of total execution time. The former needs to be cached or optimized; the latter needs to be investigated.
The diagnostic tool that translates a slow query into an optimization direction is the execution plan: EXPLAIN ANALYZE in PostgreSQL, EXPLAIN FORMAT=JSON in MySQL, or the execution plan viewer in SQL Server Management Studio. The execution plan shows how the database engine chose to execute the query: which indexes it used, whether it performed a table scan, how it executed joins, and where it estimated versus actually processed row counts.
Run EXPLAIN on the slow query to find full table scans and missing indexes, then add indexes on the filtered and joined columns, rewrite the query to avoid SELECT * and functions on indexed columns, and check server settings like InnoDB buffer pool size to ensure the working dataset fits in memory. A full table scan on a large table is almost always the first finding, and the fix is almost always an index on the column in the WHERE clause, JOIN condition, or ORDER BY clause that is causing the scan.
The query rewriting interventions that most consistently eliminate slow queries without requiring schema changes are: replacing SELECT * with explicit column lists (which reduces the data transferred from the database engine and allows covering indexes to satisfy the query without reading the base table), moving functions off indexed columns (since WHERE YEAR(created_at) = 2025 cannot use an index on created_at but WHERE created_at BETWEEN ‘2025-01-01’ AND ‘2025-12-31’ can), and converting subqueries to joins where the query planner produces a better execution plan for the joined form.
Caching Strategy: Not Asking the Application to Do the Same Work Twice
Caching stores the results of expensive operations. Indexing makes data easier to find. Together, they slash latency; don’t ask the application to do the same work twice. What to cache: authentication tokens, product or content metadata, and time-based queries that aggregate across large datasets for dashboard or reporting purposes.
The caching architecture for a production server-side application operates across three layerseach with a different access latency, a different invalidation mechanism, and a different appropriate use case.
In-memory caching
(Redis, Memcached) provides sub-millisecond access to the most frequently requested data. It is the layer that absorbs the database queries that would otherwise fire on every request: user session data, product catalog entries, authentication results, feature flag configurations.
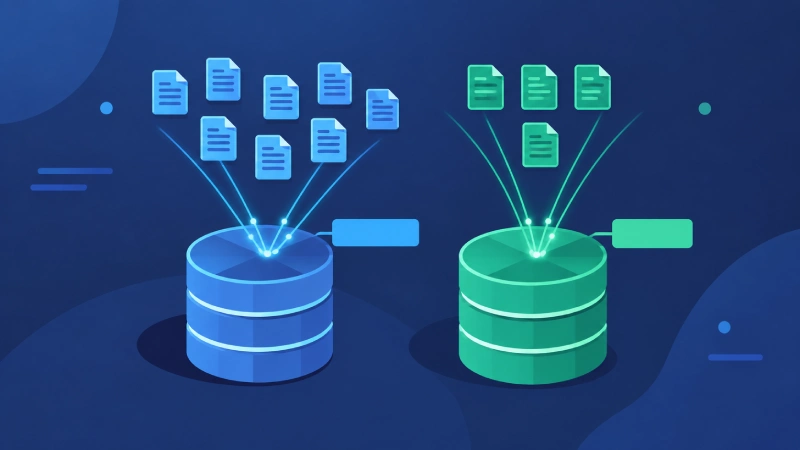
The cache hit rate for each cached data type is the metric that confirms whether the cache is providing meaningful load reduction; a hit rate below 80% for data that should be stable indicates either a TTL that is too short or a cache key design that fragments what should be a shared cache entry.
Query result caching
caches the output of expensive database queries that aggregate across large datasets and change infrequently. Dashboard queries that count and group across millions of rows, reporting queries that join five tables to produce a summary, and any query whose result is the same for all users within a defined time window are the candidates for query result caching. The correct TTL for query result caching is the staleness tolerance of the data; a user count shown on an admin dashboard can be 5 minutes stale; a payment balance shown in a user’s account view cannot.
Application-level caching
holds data closer to the computation, in the application process’s own memory, using language-native data structures, for data that is read frequently within a short time window and does not need to be shared between application instances. Configuration values, permission matrices, and product pricing are the typical candidates: data that changes rarely and that the application would otherwise fetch from Redis on every request.
The stampede protection that HybridCache provides in .NET 2026 prevents the thundering herd problem; when a cache entry expires under high concurrency, without stampede protection, all waiting requests simultaneously miss the cache and simultaneously hit the database, causing the exact load spike that the cache was designed to prevent. HybridCache coordinates these simultaneous misses so that only one request fetches the fresh value while the others wait, then serves the cached result to all. Redis’s SET NX pattern and probabilistic early expiration are the two most common approaches to solving the same problem in non-.NET environments.
Concurrency Handling: Where Sequential Performance Analysis Fails
Single-user profiling reveals computational bottlenecks. Concurrency analysis reveals contention bottlenecks, the slowdowns that only appear when multiple users are making requests simultaneously.
Locks, deadlocks, and wait time under concurrency are the contention signals that explain slowness spikes that do not appear in single-user profiling. A query that executes in 50ms in isolation may wait 2 seconds for a row lock under twenty concurrent users, and the wait time is invisible to single-user profiling tools. Concurrency monitoring in the database (MySQL’s SHOW PROCESSLIST, PostgreSQL’s pg_stat_activity, SQL Server’s Dynamic Management Views) surfaces the queries that are waiting.
Connection pool saturation is the concurrency bottleneck that manifests most visibly as spiky, correlated latency increases during peak traffic. When the application’s connection pool is exhausted, requests queue for an available connection. The queue introduces latency that is entirely distinct from query execution time; a 10ms query that waits 500ms for a connection produces a 510ms response time that no amount of query optimization will improve. Monitoring the connection pool’s used versus available connections at peak and sizing the pool correctly for peak concurrent request rates is the fix.
Thread pool and async handling are the concurrency dimensions at the application layer. A synchronous blocking call to an external service (a payment API, an email service, a third-party data provider) blocks the thread for the duration of the call. Under concurrent load, blocking calls that collectively account for a small fraction of individual request time can saturate the thread pool, causing requests to queue at the application layer. Connection pooling for databases and asynchronous LINQ to boost overall performance are the remediation patterns; async/await for I/O-bound operations releases the thread during the wait, allowing the same thread to serve other requests while the I/O completes.
The Performance Tuning Sequence That Works
The sequence that consistently produces the fastest improvement: enable slow query logging and profiling before changing anything, identify the top bottlenecks by total time impact, fix database queries first (adding missing indexes is the highest-yield first step in almost every performance investigation), layer caching on top of optimized queries, then address concurrency bottlenecks in connection pools and thread management.
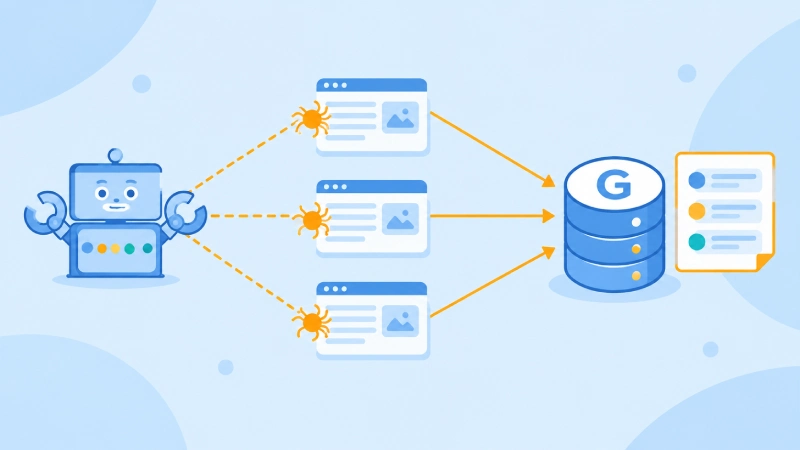
The seven core database performance tuning techniques are: monitoring and profiling first, then indexing strategy, query optimization, connection pooling, caching, server configuration tuning, and schema design review; in that order, because the monitoring and profiling step determines which of the subsequent techniques will have the most impact for the specific system being tuned. The team that measures first and fixes second always outperforms the team that guesses first and measures after the fix to see if it worked.
What to Watch Next
The direction of server-side performance tooling in 2026 is toward continuous profiling embedded in production observability; Parca, Pyroscope, and the continuous profiling features added to cloud-native observability platforms sample production applications at low overhead continuously. The result is a flamegraph for any time window, comparable across deployments, that shows whether a release introduced a new computational hot path before it produces a measurable increase in P99 latency. Combined with slow query analysis that surfaces regressions before they become user-reported incidents, this is the performance engineering practice that prevents the most expensive class of performance problems: the ones that accumulate invisibly until they become production fires.
(Source)