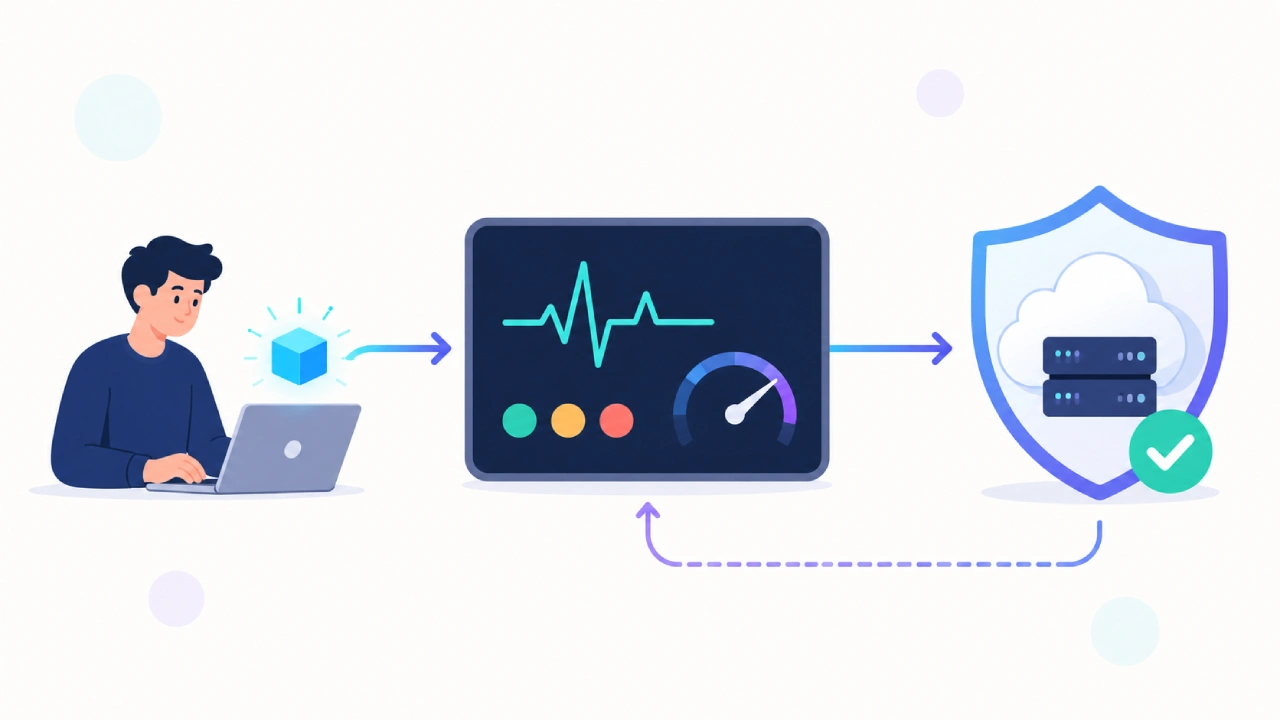
A deployment can look successful on the infrastructure dashboard, while users get stuck with slower page loads. Implementing System Observability gives engineering teams the context needed to investigate what a production system is really doing, moving beyond basic uptime metrics to debug complex, unexpected issues in modern software architectures.
All of this points to a core issue in modern software engineering: just because you can tell something is wrong doesn’t always mean you can tell why, quickly or even at all.
Traditional monitoring is still hugely useful, especially when you’re dealing with conditions you already know how to recognize. Teams can watch CPU utilization, memory consumption, request rates, error counts, uptime, and other preset indicators. But as systems become more distributed, failures can show up with causes that are hard to guess ahead of time, and the signals you need may not be obvious until later.
This is where observability in production matters.
Observability, in practice, is the visibility that gives engineers the context needed to investigate what the system is really doing, including the unexpected. OpenTelemetry frames observability as the ability to understand a system from the outside and dig into novel problems, or what people sometimes call “unknown unknowns,” as long as the application emits the right telemetry metrics, logs, and traces.
The goal isn’t merely to gather more data, more and more. The goal is to make production systems actually understandable.
System Observability: What Is Observability?
In simple terms, observability is the habit of making it possible to answer questions about what a production system is doing, and also why.
That distinction helps keep observability separate from conventional monitoring. DORA frames monitoring as a way to watch and understand system state through those predefined groups of metrics or logs. Observability goes a bit further because it helps teams debug and explore behaviors or signals that may not have been planned ahead of time.
Imagine an online application suddenly becomes sluggish.
A monitoring dashboard might tell an engineer, “Latency has increased.”
Observability should help the engineer keep asking, “Which requests are slow?”
Then, “Which service is responsible?”
Then, “Is that service waiting on a database, another API, or maybe a queue?”
And eventually, “What changed right before this situation began?”
That step from symptom to surrounding context, then to root cause, is really where production observability pays off.
Monitoring vs Observability: Why the difference matters
Monitoring is still essential, no doubt. Teams rely on dashboards and alerts that basically say when a service feels “off,” when it looks unhealthy. Without those signals, engineers might not notice an incident has started, like not for real, not until it’s already spreading.
That said, monitoring usually begins with questions the team already expects to ask.
For example:
- Is the error rate above five percent, right now?
- Is CPU utilization too high?
- Is latency above the defined threshold, even briefly?
- Is the database running out of connections, again?
Observability is more exploratory. It helps engineers dig into problems, even when they never thought to put that exact question into a dashboard in the first place. Instead of “Do we see X?” it often becomes “What is actually happening here ?” and “Where did it start?”
This gap really shows up in microservices and cloud-native systems. A single user request can hop through a long chain of services, databases, queues, caches, and external APIs, all while everything changes mid-flight.
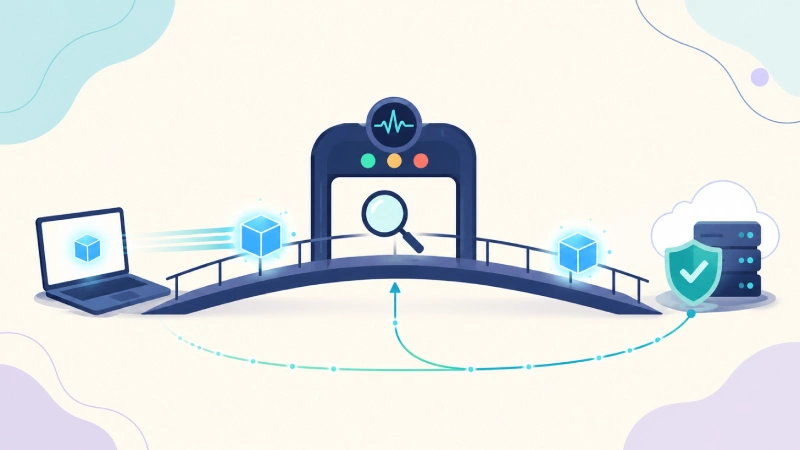
Google’s Site Reliability Engineering guidance makes a similar split, stressing that you need to understand both what is broken and why. Their monitoring principles also point people toward the four golden signals: latency, traffic, errors, and saturation for user-facing systems.
The Three Core Signals: Metrics, Logs, and Traces
The foundation of modern observability- metrics, logs, and traces is mostly built around three major telemetry types.
They answer different questions, even if sometimes you assume they all do the same thing.
Metrics: What Is Happening?
Metrics are numerical measurements gathered over time. Examples include
Request rate, Error rate, CPU utilization, Memory usage, API latency, Database connections, Queue depth
Metrics are especially helpful for spotting trends and, you know, triggering alerts.
For instance, a sudden increase in HTTP 500 responses can quickly hint that a service is running into trouble.
Google’s SRE guidance highlights latency, traffic, errors, and saturation as the four golden signals for monitoring systems that users actually touch.
So metrics are great at answering, “Is something changing?” But they often won’t tell you what caused that change, not directly.
Logs: What Happened?
Logs are the detailed records of what’s going on inside an application or maybe an infrastructure component. A log might note a failed authentication attempt, a database connection error, a payment transaction, a configuration change, an exception, or even a deployment event.
Unlike metrics, logs can include rich contextual details about single events, not just a number floating around. For example, a metric could show that payment failures went up around 14:03.
But a structured log can uncover that those failures were tied to a particular downstream payment provider, like, say a specific vendor endpoint.
DORA frames logs as records of events, and it also says that structured logs may include timestamps, servers, and environmental information, all of which gives useful context for humans. Still, in big applications, the volume of logs can become massive, almost too much.
And just storing more logs doesn’t automatically mean better observability, no matter how much data you stack up.
Traces: Where Did the Request Go?
Distributed tracing becomes really valuable when apps are built out of lots of connected services, kinda like a chain where every link matters.
Take a customer placing an order.
One request can wander through something like:
Mobile app → API gateway → authentication service → product service → inventory database → payment service → order service → notification service
If that whole thing takes six seconds, the real question is: which component quietly caused the delay?
A trace can help you sort that out. A distributed trace follows a request across many components, using separate spans. OpenTelemetry talks about a span as a unit of work that includes timing data plus metadata about a particular operation. Several spans can then be stitched together into one trace, which represents the larger request journey.
This is why traces are especially strong for finding bottlenecks in distributed architectures, and yes, it’s a bit like turning a flashlight on the whole path, not just one room.
Observability and Business Performance
Production observability is not just a technical thing, it’s a business thing too
App reliability affects business outcomes straight up. And yeah, the numbers move.
If the checkout is slow, sales can drop. If authentication is failing, customers can’t reach their accounts, and that’s it.
When a recommendation engine is degraded, engagement often slips.
If a payment API breaks, revenue can take an immediate hit.
That’s why modern observability increasingly takes a “two worlds at once” approach: technical telemetry plus business context, not just one side.
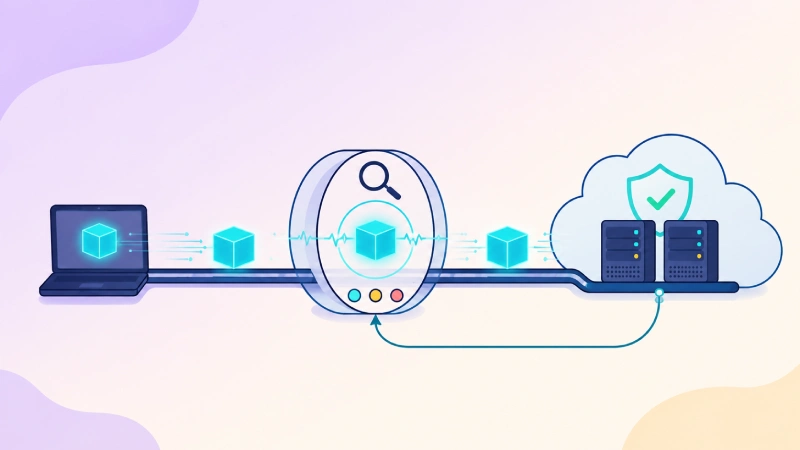
Rather than watching just CPU usage, teams can also watch things like:
- Successful transactions
- Checkout completion
- Search success
- User sign-ins
- Subscription conversions
The goal is to figure out not only whether the infrastructure is healthy, but also whether the product is delivering the expected experience.
DORA, in the same spirit, focuses on monitoring systems and using the feedback to steer both technical and business decisions.
Observability Best Practices for Production
A good observability best practices approach usually starts with the questions engineers and product teams really have to answer, not the ones that sound nice on a slide. In practice, instrument applications around key user journeys and clear service boundaries, rather than collecting random telemetry for its own sake. Also, teams have to set practical service-level objectives and spell out what kinds of situations should trigger alerts, before something goes sideways.
Structured logs plus consistent request identifiers, distributed traces, and the right application-specific metrics can make troubleshooting way simpler. But there is a catch. Sensitive information has to be treated with care. Observability pipelines may end up containing auth details, user identifiers, transaction context, and other data that could expose people or systems. So retention time, access controls, redaction steps, and security rules need to be built into the observability architecture from day one.
And last, don’t forget to test it. A team should be able to tell, with the signals they already gathered, whether they can diagnose a production failure, or at least narrow it down quickly enough to be useful.
The Future of Production Observability
Observability is changing, as modern software architecture keeps moving. When systems turn more distributed, and these AI-driven apps bring in additional infrastructure layers, teams are going to need more advanced methods to figure out what’s really happening in production, not just guess. Also, how people view observability is starting to stretch beyond the classic three signals.
In fact, the CNCF talked about it in a 2026 session on sustainable telemetry pipelines, and they brought up profiles alongside metrics, logs, and traces as a natural add-on. The point was that profiling can give you code-level clarity, especially for those CPU and memory hotspots; it’s pretty granular.
AI-assisted analysis is also expected to matter more over time. Rather than forcing engineers to manually dig through thousands of telemetry records, future tooling may connect the different signals automatically and propose the most likely causes, like correlations without the whole scavenger hunt. Still though, automation won’t fully remove the need for thoughtful instrumentation.
Because AI only reasons as well as the data it gets, if the telemetry is missing or unclear, it can’t magically fix that gap.
Conclusion: Visibility Is the Foundation for Safer Software Delivery
Modern software can’t really be treated like a black box once it is deployed.
Things keep shifting all the time: applications evolve, infrastructure scales dynamically, dependencies get flaky, and user behavior changes. Even new releases can bring in unexpected interactions, almost quietly at first.
Traditional monitoring still matters a lot. It catches known conditions, sure. But observability in production gives the extra, deeper context you actually need to figure out why those conditions show up in the first place.
Metrics point at patterns. Logs tell what happened, the events and little surprises. Traces show journeys, how requests move through the system.
When these signals are tied together, engineering teams can move from detection to diagnosis, then remediation, much more directly.
That truly affects delivery. Developers can ship changes with better confidence, spot regressions earlier, and recover from incidents more effectively. So, the intent of observability is not to build the biggest dashboard or collect the largest possible pile of telemetry. The point is to make production understandable.
In a world of continuous delivery, distributed systems, cloud infrastructure, and applications that keep getting more complicated, this kind of understanding is what helps organizations move fast, without losing control . Ultimately, faster releases and safer deployments both depend on the same simple idea: knowing what your software is doing when real users are relying on it.