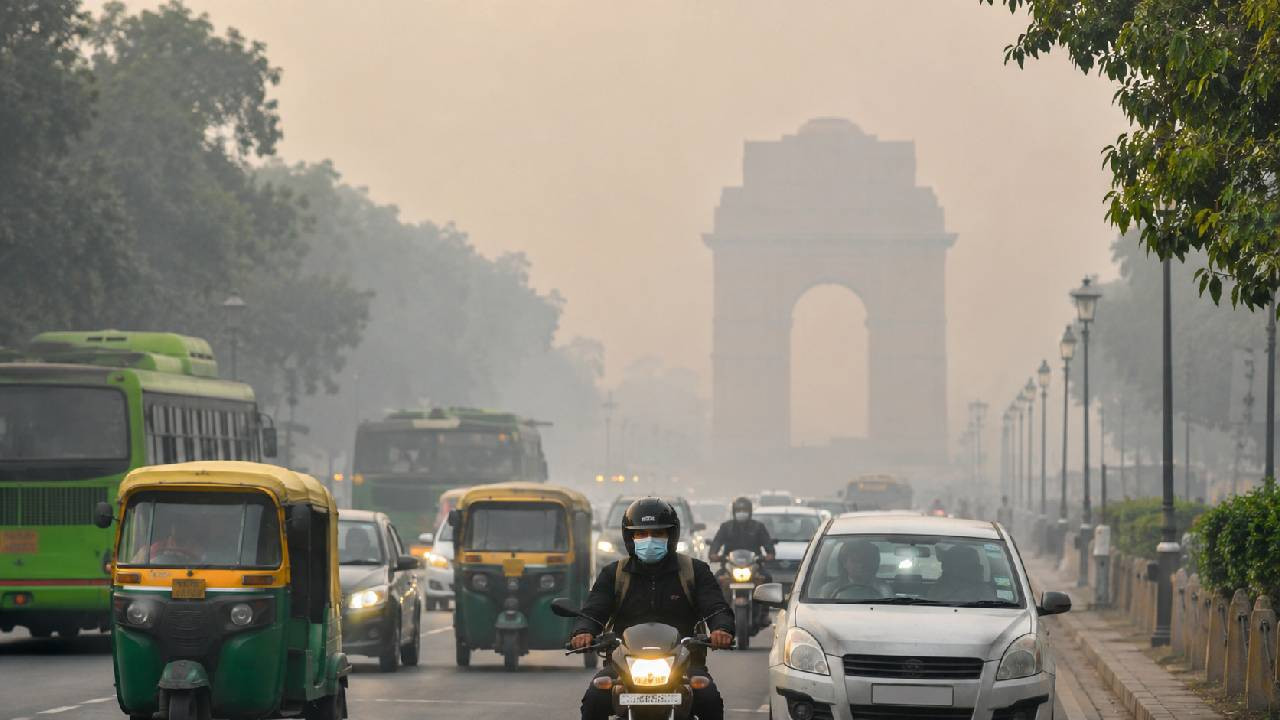
With increasing coldness in the weather, the effect of air pollution has also started becoming visible in the metropolitan cities of the country. The air quality data released on November 4 shows that the air in the capital Delhi has reached a worse condition than other major cities. Here the air quality index i.e. AQI was recorded at 269, which falls in the poor category. On the other hand, the pollution level in Mumbai and Kolkata remains moderate. The picture looked somewhat better in the cities of South India. The air in Chennai and Hyderabad remained in the satisfactory category, while Bengaluru recorded moderate levels. The situation may change in the coming days due to changes in weather, wind speed and stagnation of pollutant particles in the atmosphere. In such a situation, it is important for people to keep an eye on the air quality of their city and take health precautions when pollution increases.
AQI 269 in Delhi, most worried about the capital
According to the data available on November 4, New Delhi's AQI was 269. On the Indian air quality scale, a level between 201 and 300 is considered poor. This means that the amount of pollution in the air has reached such a level that sensitive people may suffer health problems. With the onset of winter, increasing pollution levels in the capital are becoming a matter of concern.
No complete relief even in Mumbai and Kolkata
AQI was recorded at 161 in the country's financial capital Mumbai, while Kolkata's index was 155. Both the cities are included in the middle category. There is no need for immediate serious problems for common people at this level, but living in a polluted environment for a long time can cause problems to sensitive people. Children, elderly and people suffering from respiratory problems need to take special care.
Air condition better in cities of South India
Air quality was recorded relatively good in Chennai and Hyderabad. Chennai's AQI was 81 and Hyderabad's was 71. Both the cities are in satisfactory category. The index in Bengaluru was recorded at 110, which indicates moderate level. Thus, among the six cities available, Delhi was in the worst position, while Hyderabad's figure was the lowest.
Delhi's air is the most polluted among the six metros, Hyderabad's situation is better.
If we look at the air quality data of six major cities, New Delhi was in the worst position with 269 AQI. The level was recorded at 161 in Mumbai and 155 in Kolkata, while both the cities were in the moderate category. Bengaluru's AQI stood at 110, which indicates moderate level. On the other hand, an index of 81 was recorded in Chennai and 71 in Hyderabad. Both these cities remained in satisfactory category. It is clear from this comparison that among these six metros, the air of the capital was the most polluted, while the air quality in Hyderabad was relatively better.
How to understand air level from AQI
Air Quality Index is a scale through which the pollution present in the environment and the possible health effects associated with it are understood in numbers. The Central Pollution Control Board i.e. CPCB prescribes six categories for this. A level of zero to 50 is considered good, 51 to 100 satisfactory, 101 to 200 moderate, 201 to 300 poor, 301 to 400 very poor, and 401 to 500 severe. It is calculated on the basis of pollutants like PM2.5, PM10, nitrogen dioxide, sulfur dioxide and ozone.
Why are PM2.5 and PM10 dangerous for the body?
PM2.5 are very small particles whose size is 2.5 micrometers or less. PM10 includes particles up to 10 micrometres. PM2.5 particles reaching the body with breath can reach deep parts of the lungs. Their excessive presence can increase breathing problems and worsen pre-existing heart and lung diseases.
Children and elderly need to be more cautious
In addition to people with asthma, respiratory disease and heart problems, young children and the elderly may be at greater risk from polluted air. It is useful to avoid prolonged stay outside and heavy physical activities on days with poor quality. People should keep watching local AQI updates. Keep in mind that the data may change throughout the day due to weather, wind direction and different monitoring stations.